Making sites easy to work with and making them work with speed is interesting work. So when we apply the first set of optimizations while setting up (basic CDN, nearest data center, normal CPU) a site running Woocommerce plugin and WordPress, its net performance looks like this.
This is page load time-related data of the following link: https://indicbrands.com/product-category/books/hinduism/ a list of 20 books and good header and footer and a category tree. The goal here should be to make it faster, also more speed and scale can help us be ready for the time ahead when multiple users are going through the site. Let’s see what we can achieve to improve this snapshot! Hope this exercise helps you as well!

Now this was first page load with a disabled cache, which means we fetched all the resources for the first time into the client browser. The image says it took 8.7 MB resources to create this basic-looking page, well its too much for sure. we just want a grid of 20 books, some text a logo and some icons! 8.7 MB is too much resource for it, probably this is decompression of 2.7 MB transferred resources. If we can bring this data in size, everything would anyway automatically improve. Out of this most of resources are one-time fetch and they would be resued from the memory cache of browser in next requests but that’s different thing to optimize. We would note this point as improvement point No 1 and lets move to other points.
Improvement Point 1: Reduce Amount of data to be transferred when loading First Time (or first page)
The next thing to do is to make sure on the subsequent request the static resources are loaded from the browser memory!

We can see only 1 MB of data got transferred in next requests! Although its our primary goal to reduce the data size as noted above. Now coming to the time of main document load and its size, its around 50 kB and takes less than a second, its good number is already there. (thanks to CDN provider bunny!). We can see most of resource are cached either locally or its served from CDN. We can set our next goal of serving the remaining resources from the CDN which are missed here.
Improvement Point 2: Make sure All static resources are served from CDN
Now the resource numbers are moderate to high and analyzing them manually is time time-consuming task, so we will utilise the lighthouse or GTMatrix or Pingdom like tools to analyse what we can do in terms of individual resources. After this we will think about what we can do from server end, code end, and page design point of view.
So the same page has been analysed in the lighthouse for the below score. Our speculation was right there’s lot can be done interms of performance. It says we already follow best practices so we would ignore that part. Also, accessibility suggestions we will see later on. L:ets see what it has to say about performance.

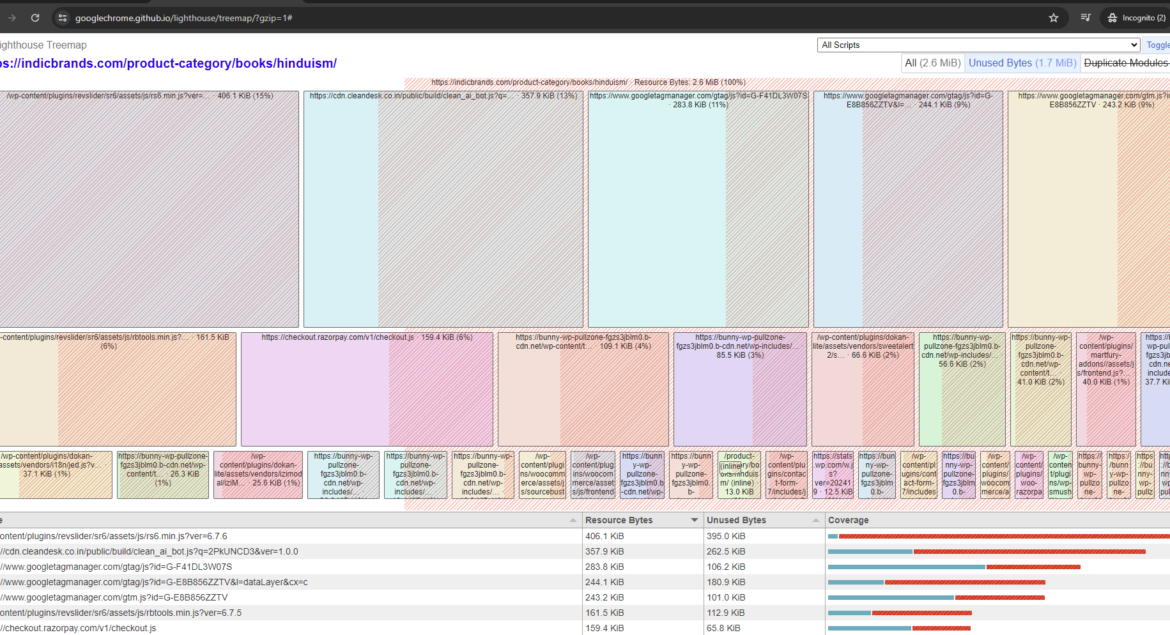
Before moving to the performance analysis by lighthouse, we can see one more important fact that most of the content downloaded is not used in one or another way, I am not giving surety about what it means by unused but the below treemap analysis of resources, and their relative size says, 50% of the content is UNUSED

At this point, we should note our third action point to minimize the unused content in some ways!
Improvement Point 3: Improve treemap and reduce unused bytes
Now let’s look at Performance numbers and then suggestions,

The first Contentful Paint took 1.3 Seconds, Ideally, it should be less than 1.8 second so we are doing good in this regard.
Next is the Largest contentful Paint (LCP measures when the largest content element in the viewport is rendered to the screen. This approximates when the main content of the page is visible to users.) 3.3 Second is a longer time for this, we should try to make it less than 2.5 seconds. (https://developer.chrome.com/docs/lighthouse/performance/lighthouse-largest-contentful-paint)
now next is the total blocking time, it should be ideally less than 200 ms , so we are almost doing good in this, still we should see what we can do about it. Cumulative Layout Shift is already good meaning our page is delightful and easy on human eyes and content doesn’t move much once loaded on the screen. Next is the Speed Index, Speed Index measures how quickly content is visually displayed during page load. Lighthouse first captures a video of the page loading in the browser and computes the visual progression between frames. we have a higher speed index, which means content takes times to get displayed on the page even after it has loaded or while loading. That means something is blocking them, it can be font or it can be pending style or main thread is busy somewhere, ideally it should be less than 3.8 seconds.
Improvement Point 4: Make LCP < 2.5 seconds, TBT < 200 milliseconds, and speed Index < 3.8 seconds
Now first diagnostic suggestion is to reduce initial server response time,

as discussed earlier or to be discussed (in this post) how we tune the OpenLiteSpeed Server on Ubantu machine to fit our requirements and overcome some of the deadly deadlock bugs. This tuning insight would be very helpful in rendering the first suggestion. The Initial server response time is correlated to Type to first Byte TTFB matric. We should see what is good TTFB in real world scenario in normal network speed and how to achieve it. That would optimize initial server response time. Also we have very inconsistent server response time due to existing deadlock kind of situation in some of the pages. The intensity has reduced but still it is affecting some of pages a lot. ideal TTFB is very subjective topic, it depends on the page, user’s condition and what operation they are doing.

A diagram of network request phases and their associated timings. TTFB measures the elapsed time between startTime and responseStart. Ideally, TTFB should be less than 0.8 second but lets try to achieve it below 1.8 Seconds. Here consistency is very important, some of our page has TTFB less than 500 ms, but sometime, due to deadlock bug and sometime due to other server states, it takes way beyond, for example, light house noted it as 5.3 Second!
Improvement Point 5: Make time to first byte less than 1.8 Second consistently
If we can improve the above factors, that would largely cover network bottlenecks! Next is the main thread work, it is not invisible to the eyes but still very important when payload delivery is already slow! Also, its very important to focus on it as it aims to reduce the payload size in some ways, it helps overall performance. we can see some ‘Other’ tasks took 996 ms, Style & Layout took 721 ms while Script Evaluation took 629 ms! We should improve it but that’s again a on-page optimization and would require good amount of programming effort so we would see it next set of activities (in this post). Ideally, main thread work should be less than a second IMO.

Next is DOM size, a very vital aspect of on-page optimization, ideally there should be less than 800 DOM elements, or else the lighthouse starts warning. Reducing this requires programming and styling efforts. So we will also cover this in the next iteration (in this post).

Next is eliminating render-blocking resources, this also would require some programming efforts or style changes but is an essential bottleneck to remove, it could save around 450-500 ms, the interesting part is 3rd party resources (including CDNs) too are render-blocking and its really good idea to defer them!

for example this icon and style

And this whole set of 3rd party render blocking scripts.

There can be a saving of 350 ms in removing the above render-blocking elements if they are not critical and if they are unused! Segregating them is a huge task but worth the effort. So improvement point is collection of removing, differing and reorganizing javascript, CSS and other files to achieve the following goals.

Improvement Point 6: Reorganizing CSS and JS, reduce unused
Next is reducing payload size, first unused thing found that each page doesn’t require the slider plugin or requires it late,

Similarly, avoiding document.write and deferring offscreen images will more improvement.


there are many other suggestions too for on-page optimization but first we will focus on reducing server waiting time and reducing payload size to drastically change the above performance score to 75 and discuss the result in the next set. See you all!